Timescale Newsletter Roundup: May Edition

From big news (multi-node TimescaleDB will be available for free!) to tons of new tutorials, demos, and remote-bonding tips, May was chockfull of time-series data and technical resource goodness 🥳. Check out the below for the Reader's Digest version.
We’re always releasing new features, creating new documentation and tutorials, and hosting virtual sessions to help developers do amazing things with their data. And, to make it easy for our community members to discover and get the resources they need to power their projects, teams, or business with analytics, we round up our favorite new pieces in our biweekly newsletter.
We’re on a mission to teach the world about time-series data, supporting and growing communities around the world.
...sharing educational resources as broadly as possible is one way to do just that :).
Here’s a snapshot of the content we shared with our readers this month (subscribe to get updates straight to your inbox)
New technical content, videos & tutorials
[Session Replay]: Guide to Grafana 101 Part II: Getting Started with Alerts >>
In our latest “Guide to Grafana” session, @avthars breaks down how alerting works in Grafana (30+ mins of demo!). You’ll learn how to define and configure 3 kinds of alerts, trigger notifications via PagerDuty, Slack, and OpsGenie, and customize alerts for your projects.
- 🎁 Check out our Grafana Alerting tutorial to get started right away.
- 🙌 Want more Grafana goodness? RSVP for Guide to Grafana Part III (more details below)

[Live-coding session] Guide to Grafana 101 Part III: Getting Started with Interactivity, Templating & Sharing >>
We’re having fun learning all things Grafana, and Avthar’s next (demo-packed) session will show you how to create interactive reusable dashboard templates that you can clone and share with teammates, set up version control, and much, much more.
- 👉 Sign up here - even if you can’t attend live on June 17th, you’ll receive the recording & all resources.
[NEW Demo]: Learn how to use real-time aggregates to increase query speed, optimize storage, and get up-to-date results >>
In this short video, we take you through how to use real-time aggregates in a sample DevOps scenario, compare results to vanilla continuous aggregates, and show you how to massively speed up workloads that process large amounts of data.
- 🏁 Check out our docs to learn more and get started.
[NEW 3 step tutorials]: Monitoring Django Apps with Prometheus & Visualizing Missing Data in Grafana >>
Our latest docs focus on helping you use open-source tools to do more with your data, whether it’s monitoring your production apps’ metrics to catch issues, or visualizing your data to see patterns over time.
- ⛑ Follow the Prometheus tutorial to start tracking your Django apps’ performance.
- ⏳ Follow the Grafana tutorial to solve for gaps in your dataset, so you can aggregate and visualize values.

New #remote-friendly events & community
[Session Replay]: DataPub #3: Solving Urban Mysteries with Public Data > >>
Data viz expert @Chris_Whong and data architect @jon_leek share how they use (+ wrangle and clean) public data to help citizens and policy makers understand and analyze complex queries, like NYC subway ridership trends and St. Louis property vacancies.
- 💛 and 🙏to both of our guest speakers (and the 75+ fellow data enthusiasts who registered!)
- 👉 Join DataPub #4 on June 16 to hear from even more amazing guests
[Community Spotlight #1]: How clevabit builds a data pipeline to turn agricultural IoT data into insights >>
Our friends at clevabit detail how they’re giving farmers and hatcheries the data they need to make decisions (like how to reduce costs, without sacrificing quality or animal health). See how they’ve set up their architecture, example queries, and their advice for community members.
- 👋 Find clevabit co-founder Chris on Twitter (@noctarius2k)

[Community Spotlight #2]: How SolarNetwork Fuels Energy Conservation with TimescaleDB >>
Our friends @ SolarNetwork Foundation share how they’ve created a charitable foundation (and 100% open source project) to allow everyone - from citizens to organizations - to connect to hundreds of data sources & understand energy consumption.
- 🌤 Get SolarNetwork APIs and various queries on GitHub.
- 🙋 Want to share your story in a future spotlight? Reach out on Slack (@lacey butler), and we’ll make it happen.
[Writing Opp] Introducing Write for Timescale >>
If you love to write, are passionate about using data to build applications, learn about the world, and make better decisions – and want to share your knowledge with the world (and get paid for your efforts), Write for Timescale’s for you!
- ✍ Submit as many proposals as you’d like.
Etc.
[Product Development]: A multi-node, elastic, petabyte scale, time-series database on Postgres for free (and more ways we’re investing in our community) >>
Late last year, we announced our plans for a multi-node version of TimescaleDB (currently in beta and slated for release with TimescaleDB 2.0 in the coming months) – and this week, we announced our plans to make it available for free. Ajay - Timescale CEO & co-founder - shares details on what's coming, more ways we're supporting the community with other new free capabilities, and how to get involved.
- 🐯 Get started with the multi-node beta
- 💬 Join our public Slack #multi-node channel to share feedback, ask questions, and learn about updates.

[Product Development]: New Prometheus Connector Design Doc >>
We’re re-booting our Prometheus adapter to make it easier to get your Prometheus data into TimescaleDB. Our existing adapter does the job, but we also know there are tons of ways we can improve –and we’d love your help to do so!
- 🛠 Check out our design plans and tell us what you like, what’s missing, and where we could do more.
- 💭 Share feedback, suggestions, and comments directly in the doc (and join the conversation on Slack).
[TimescaleDB Tip#1]: Check out our tutorials roundup page (beginner-advanced) >>
Explore 20+ step-by-step tutorials, including: Python and Ruby quickstarts, scenario-based exercises, and detailed guides to using specific TimescaleDB capabilities and integrating with popular ecosystem tools.
- 📊 Get sample datasets to get you up and running.
- Have a suggestion for a new tutorial? Let us know on Slack – or check out Write for Timescale to contribute your own.
[TimescaleDB Tip #2]: Use Real-Time Aggregation to ensure up-to-date results >>
Our latest release introduced real-time aggregates - a new feature to give you the speed and performance of continuously-aggregated views, without omitting your latest raw data. Fast, always-up-to-date results = the best of both worlds.
- 🐯 Read our engineering blog to learn how they work, how to get started, see benchmark performance, and more.
[Reading List]: Building a Global Environmental Datastack for Climate Action >>
The Blue Sky Analytics’ team is a force to be reckoned with, on a mission to be the Bloomberg of Environmental Data and the go-to source for sustainable decision making. Learn how they’ve architected their tech stack to turn terabytes of raw data into environmental insights.
- 🗺 Read their Success Story for even more info about their work.
- 🔥 Check out BreeZo, their project to monitor air quality in India.
[Reading List]: How we’re building a remote-first team culture (aka virtual event ideas that you’re welcome to steal) >>
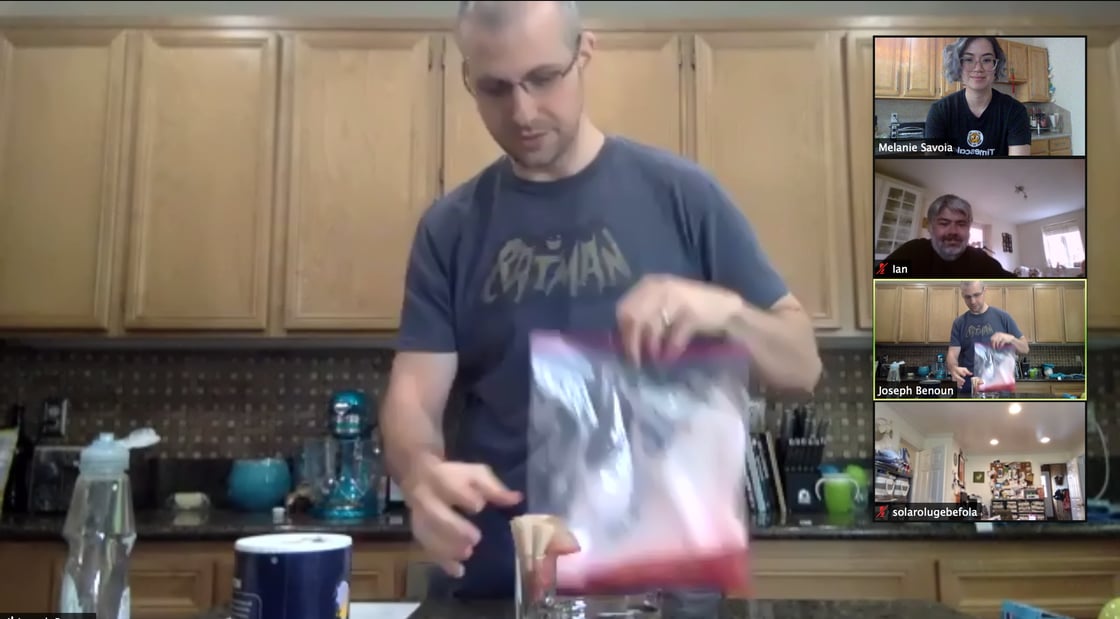
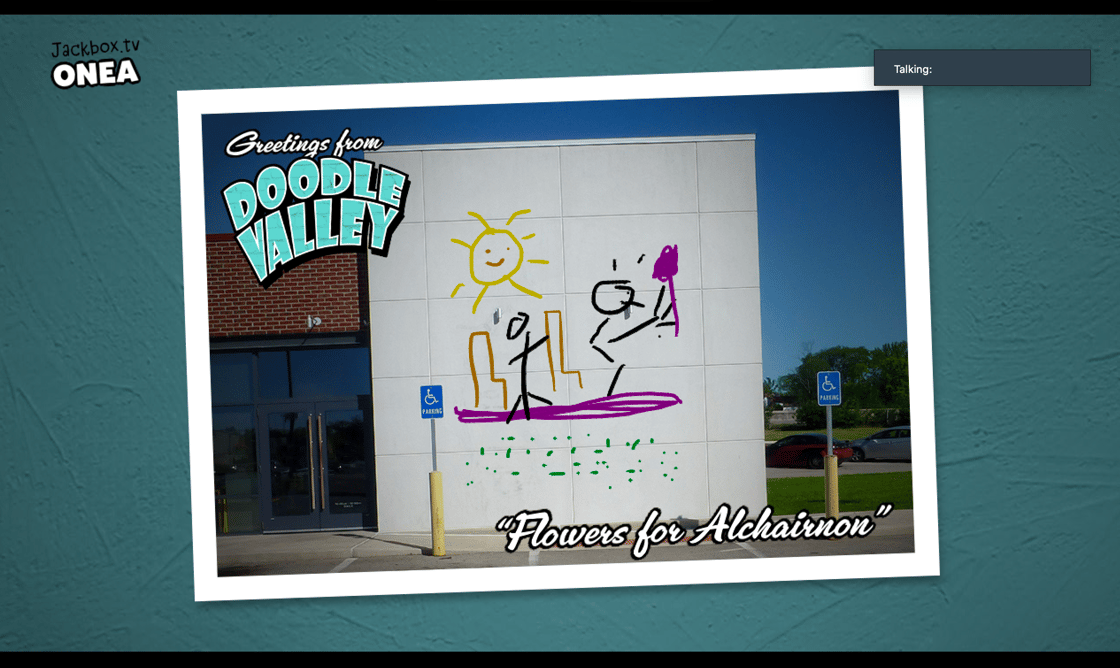
Our People Manager Mel is a pro at remote-team building activities (we’re historically 60% globally distributed across all timezones) – but COVID-19 making us 100% remote? A whole new challenge. Learn how she’s crafted activities that’ve made us feel more connected than ever before and her advice for teams everywhere.
[Timescale Team Fun]: Mel shares some of her tactics for remote team bonding in her post, and she's also brought us everything from hands-on experiments to multi-player virtual doodling games.
Wrapping Up
And, that concludes this month’s newsletter roundup. We’ll continue to release new content, events, and more - posting monthly updates for everyone.
If you’d like to get updates as soon as they’re available, subscribe to our newsletter (2x monthly emails, prepared with 💛and no fluff or jargon, promise).
Happy building!


